VVa Drift
Published: 2026-06-18 Revised: 2026-06-18
What this report does
Reports drift check results for analyzers drifted using the VVa method (40 CFR Part 60, Appendix F, Method VVa — a three-reading EPA drift procedure). Unlike the standard Analyzer Drift report which takes a single drift reading, the VVa method takes three consecutive readings per drift event. Each row represents one gas cylinder from the morning calibration and includes the calibration reading, the three individual drift readings, and two parallel compliance assessments:
- NSPS VVa — percent drift calculated as the average deviation of the three readings, used for NSPS compliance.
- Consent Decree — three individual percent deviations shown stacked, for Consent Decree compliance.
Both mid-day (Drift 1) and end-of-day (Drift 2) drift events are shown in the same row. This report is in the Calibration folder on the Reports tab.
When to use it
- Verifying that VVa-method drift checks were performed and passed during a period.
- Producing drift documentation for NSPS 60.485a (New Source Performance Standards) or Consent Decree regulatory submissions.
- Reviewing individual and averaged drift readings when a detailed drift record is required.
Parameters
| Parameter | Description | Required | How it filters |
|---|---|---|---|
| Start Date | Beginning of date window | Yes | Calibration dates on or after this date are included |
| End Date | End of date window | Yes | Calibration dates on or before this date are included |
| Analyzers | One or more analyzers to include | Yes | Only records for the selected analyzers appear |
VVa method only. This report only shows analyzers whose drift was performed using the VVa method. Analyzers drifted using the Standard method appear in the Analyzer Drift report.
Columns
| Column | What it shows | Format / Notes |
|---|---|---|
| Analyzer | Analyzer device name | Text |
| Date | Date the calibration and drifts were performed | Date; facility local time |
| Tech ID | Technician who performed the calibration | Text |
| Calibrate | Time of the morning calibration reading | Time (H:MM:SS AM/PM) |
| Cylinder | Cylinder label or serial number | Text |
| Conc | Cylinder gas concentration in PPM | Decimal |
| Reading | Morning calibration reading in PPM | Decimal |
| Pass | Whether the morning calibration passed | "Yes" or "No" |
| Drift 1 | Time of the mid-day (Drift 1) check | Time (H:MM:SS AM/PM); blank if no mid-day drift |
| Drift 1 All | All three mid-day drift readings | Stacked values (R1 / R2 / R3); blank if no mid-day drift |
| NSPS VVa Pct. 1 | Average NSPS VVa percent drift for Drift 1 | Percentage; blank if no mid-day drift |
| NSPS VVa Pass 1 | Whether Drift 1 passed the NSPS VVa limit | "Yes" or "No"; blank if no mid-day drift |
| Con. Dec. Pct. 1 | Individual percent deviations for Drift 1 (three values stacked) | Three percentages, one per reading; blank if no mid-day drift |
| Con. Dec. Pass 1 | Whether all three Drift 1 readings passed the Consent Decree limit | "Yes" or "No"; blank if no mid-day drift |
| Drift 2 Time | Time of the end-of-day (Drift 2) check | Time; blank if no end-of-day drift |
| Drift 2 All | All three end-of-day drift readings stacked | Stacked values; blank if no end-of-day drift |
| NSPS VVa Pct. 2 | Average NSPS VVa percent drift for Drift 2 | Percentage; blank if no end-of-day drift |
| NSPS VVa Pass 2 | Whether Drift 2 passed the NSPS VVa limit | "Yes" or "No"; blank if no end-of-day drift |
| Con. Dec. Pct. 2 | Individual percent deviations for Drift 2 (three values stacked) | Three percentages; blank if no end-of-day drift |
| Con. Dec. Pass 2 | Whether all three Drift 2 readings passed the Consent Decree limit | "Yes" or "No"; blank if no end-of-day drift |
Signature columns for Drift 1 and Drift 2 technician signatures may appear on the rendered report for field sign-off.
What's included and excluded
Included:
- Calibration records for the selected analyzers within the date range where the drift method is VVa.
- Drift 1 (mid-day, Noon) VVa readings matched to the morning calibration.
- Drift 2 (end-of-day) VVa readings matched to the morning calibration.
Excluded:
- Analyzers not selected.
- Records outside the date range.
- Standard-method drift records (those appear in Analyzer Drift).
- Rows where the morning calibration failed (Pass = No) — drift values are suppressed.
How key values are calculated
NSPS VVa Percent (Pct1 / Pct2)
The NSPS VVa drift percentage is the average of the three individual deviation values:
VVa Pct = Average of [(R1/C − 1)×100, (R2/C − 1)×100, (R3/C − 1)×100]
Where R1, R2, R3 are the three drift readings and C is either the cylinder concentration or the morning calibration reading, depending on how the analyzer's calibration settings are configured. If only two readings are present, the average of two is used.
Consent Decree Percent (Con. Dec. Pct.)
The individual percent deviations for each of the three readings, displayed stacked in one cell. Each value is calculated as (Reading / C − 1) × 100 using the same C as above.
Con. Dec. Pass
Passes if all three individual readings passed their respective limits. A single failing reading causes Con. Dec. Pass to show "No."
Tips and common questions
- "Drift values are blank for a row." If no Drift 1 or Drift 2 activity was recorded for that calibration session, the corresponding columns are blank. Zero gas rows do not have applicable drift calculations.
- "NSPS Vva Pass1 and Con. Dec. Pass1 show different results." They test different criteria: NSPS VVa Pass evaluates the average of all three readings; Consent Decree Pass requires all three individual readings to pass. It is possible for one to pass while the other fails.
- "Drift values show blank when the morning calibration failed." When the morning calibration did not pass (Pass = No), all drift columns for that row are suppressed — drift data against a failed calibration is not meaningful.
- "I need a simpler layout without Con. Dec. columns." Use VVa Drift – Form 2, which shows only a single drift percent per drift event without the Consent Decree columns. It also includes Probe Type and a Cal Note column.
- "The NSPS Pass column only checks the first reading, not all three." Under the NSPS VVa method, the Pass/Fail shown in this report is based on the first reading's pass field, not an independent evaluation of all three readings. If you need to verify all three readings independently, review each Deviation row individually. Consent Decree facilities should rely on the Con. Dec. Pass column, which requires all three readings to pass.
Sample output
Report run for Example Facility, Start Date: 10/4/2022, End Date: 10/4/2022, Analyzer: phx42-8696.
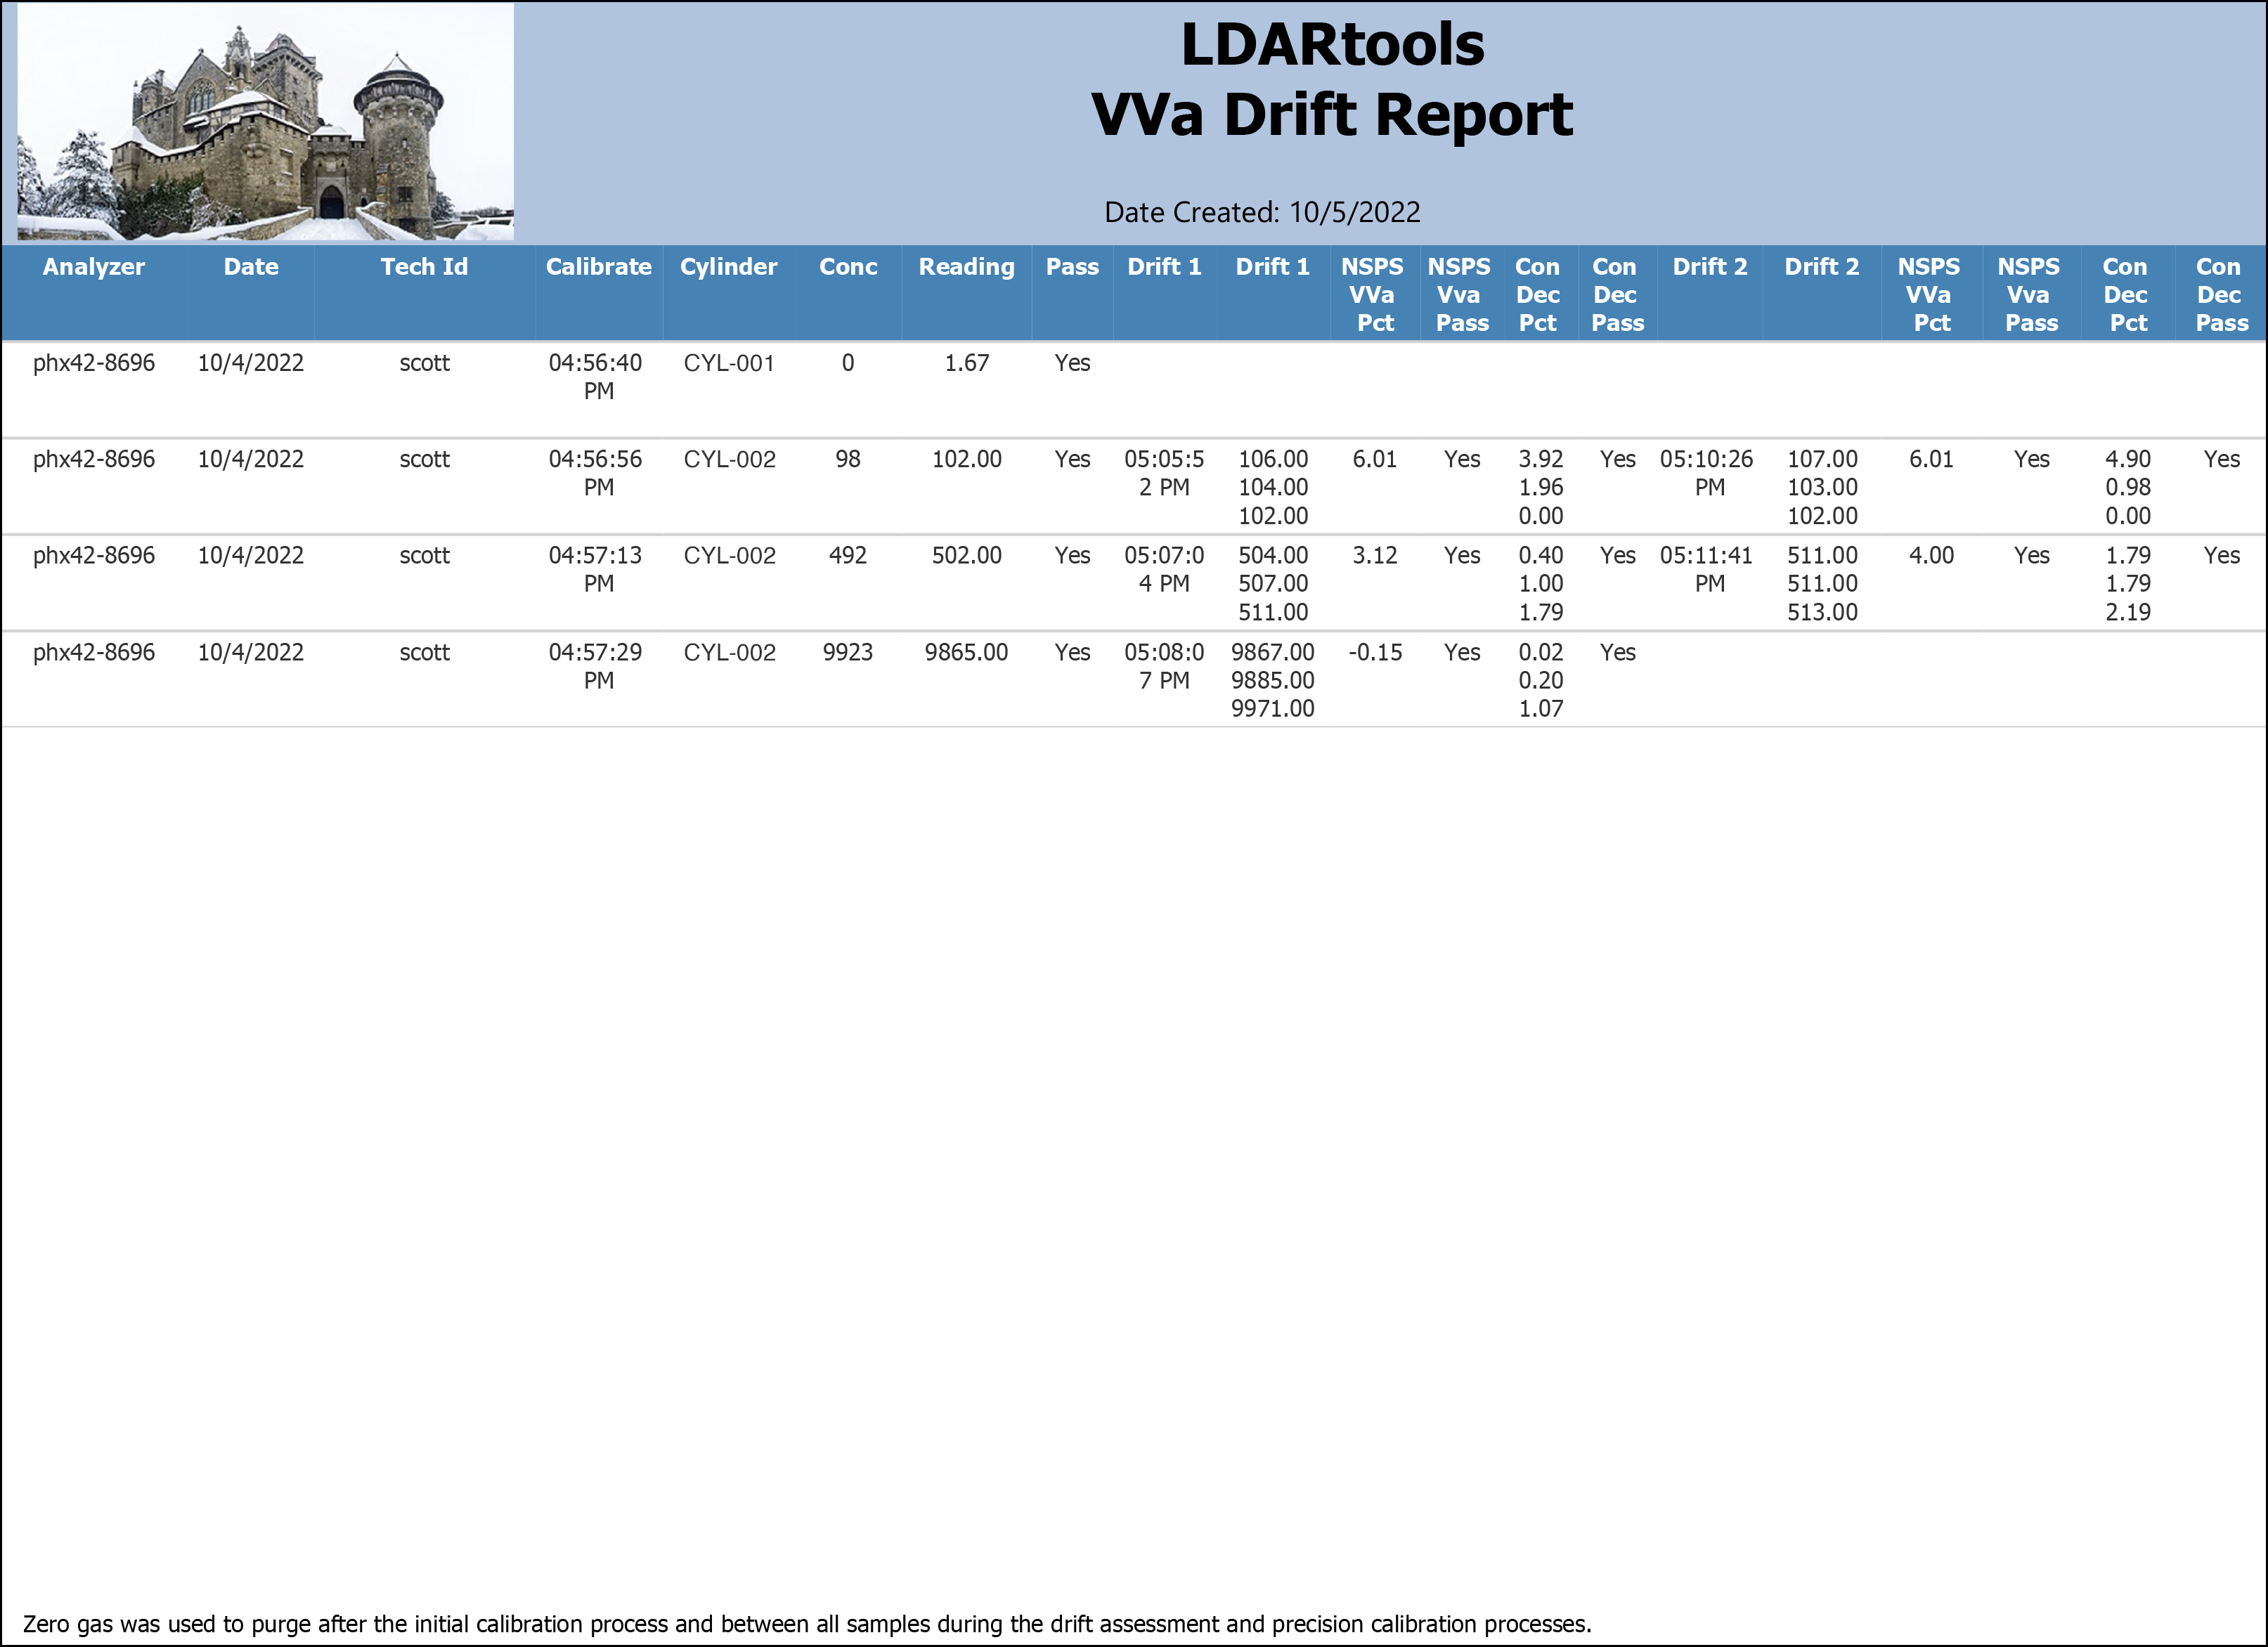
What the rows illustrate:
- CYL-001 (zero gas) — Zero gas row; no drift calculations.
- CYL-002 span gas — Three drift readings taken; NSPS VVa Pct shows the average deviation; Consent Decree columns show individual deviations.
- Drift 2 blank — If no end-of-day drift was performed on this date, all Drift 2 columns are blank.
Output format
One row per gas cylinder per morning calibration session. Drift 1 and Drift 2 readings and compliance assessments appear as additional columns in the same row. Suitable for on-screen viewing and PDF export. The stacked multi-value cells in Drift1All, Drift2All, and Con. Dec. columns are best viewed in PDF or on-screen.
Related reports
- VVa Drift – Form 2 — simplified VVa drift format; single percent per drift event, no Consent Decree columns; adds Cal Note.
- Analyzer Drift — standard (non-VVa) drift report with single readings per drift event.
- Daily Calibration — morning calibration readings without the drift check columns.